As you have probably noticed, monitoring, debugging and getting latency data for your microservices can be painful if they interact with multiple distributed services. For these types of microservices, you are usually forced to build your own performance testing application, add an inordinate amount of log statements, or simply crossing your fingers and hoping for the best. From one of AWS’s posts on the subject:
“Traditional debugging methods don’t work so well for microservice based applications, in which there are multiple, independent components running on different services.” — AWS Lambda Support For AWS X-Ray
As a result, AWS AWS X-Ray which, according to them, solves this problem:
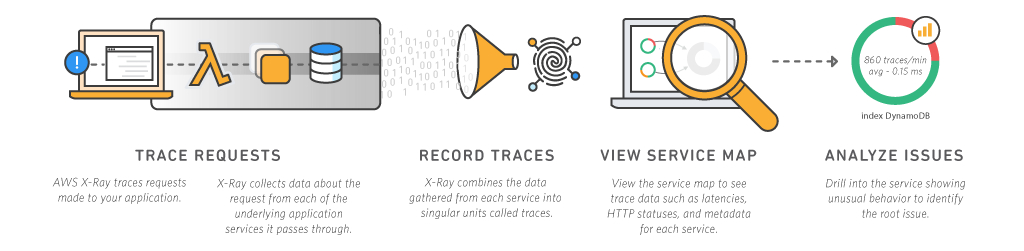
“AWS X-Ray makes it easy for developers to analyze the behavior of their distributed applications by providing request tracing, exception collection, and profiling capabilities. ” — AWS X-Ray Documentation
Back in December, AWS announced a preview release of AWS X-Ray. While this was great and awesome, if you were a serverless shop and used AWS Lambda you were still out of luck. Fortunately, in May ’17, AWS Lambda support for AWS X-Ray was released. Instrumenting your app has never been easier.
Below, I will go through the steps to update your CloudFormation template and instrument a Java application. We will then take a quick tour of the reporting and search features of the X-Ray dashboard.
Update CloudFormation
While we could enable X-Ray via AWS console, it is always better to have your application be fully deployable with a push of a button and a stack definition. On June 6, 2017 AWS CloudFormation released the TracingConfig property, that, along with a permissions change enables AWS X-Ray on your Lambda function.
Step 1: Enable TraceConfig
In your Lambda resource, you will add a new property called TracingConfig with the mode set to Active.
You will also add a DependsOn field for the execution role as the Lambda service checks permissions as soon as CloudFormation creates the Lambda function.
*Note: The default TracingConfig mode is Passthrough. This means that if any other service that has the Active mode enabled, your Lambda function will send tracing information to X-Ray. But if you access your Lambda function directly or through a service, that does not have X-ray enabled it will not send tracing information.
lambdaDemoXRay:
  Type: "AWS::Lambda::Function"
  Properties:
    Handler": "demo.XRayLambda::handleRequest"
    Role: !Join ["", ["arn:aws:iam::", !Ref "AWS::AccountId", ":role/", !Ref roleLambdaExecutionPolicy ] ]
    Description: Cloud formation created lambda for demo-xray-lambda
    FunctionName: demo-xray-lambda
    MemorySize: 128
    Timeout: 140
    Code:
      S3Bucket: my.awesome.bucket.lambda.us-west-1
      S3Key: demo-xray-lambda/demo-xray-lambda-1.3.2.zip
    Runtime: java8
    TracingConfig:
      Mode: Active
  DependsOn:
  - roleLambdaExecutionPolicy
Step 2: Add AWS X-Ray permissions
Next we need to give our Lambda function permission for the xray:PutTraceSegments and xray:PutTelemetryRecords capabilities. Here I have added a new statement to my inline policy in the execution role.
roleLambdaExecutionPolicy:
  Type: "AWS::IAM::Role"
  Properties:
    AssumeRolePolicyDocument:
     Version: "2012-10-17"
     Statement:
     - Action: "sts:AssumeRole"
       Principal:
         Service: lambda.amazonaws.com
       Effect: Allow
    Policies:
      PolicyName: demo-xray-lambda-policy
      PolicyDocument:
        Version: "2012-10-17"
        Statement:
        - Action:
          - "xray:PutTraceSegments"
          - "xray:PutTelemetryRecords"
          Effect: Allow
          Resource: "*"
There are a couple of issues that can trip you up. First, IAM is a global service. As such, when you create a new role, it needs to be propagated to all regions. There is a possibility that your role has not been propagated to your stack’s region by the time CloudFormation starts to create your Lambda function. The Lambda service will throw an exception, and the stack will fail to create if it doesn’t have xray:PutTraceSegments permission. To get around this, you can either make your policy inline in your role resource, have two separate stacks for execution role/permissions and for your Lambda function, or reference an existing managed policy. I made my policy inline and have yet to run into an issue.
Another issue is when you have an existing stack/role that you want to add the X-Ray permissions to and enable TraceConfig in the same changeSet. This fails 100% of the time. Instead what you will need to do is rename your role resource so that it creates a brand new one instead of updating the existing one. As I mentioned with the previous issue you need to have your policy inline instead of as a separate resource. You should also add a dependsOn condition to your Lambda function to avoid parallel updates and ensure it will run/complete the role before creating the Lambda resource.
Instrument The Application
We will now start instrumenting our application by adding the necessary X-Ray libraries as well as adding a few lines of code to add more color to the traces. These libraries give you the mechanism to create your own custom segments to measure the performance of a subsection of your code. They allow you to add annotations which are indexed and enable you to search for subsets of your traces. They also allow you to add metadata to your subsegments which you can use for further debugging. For more information on how to instrument your application, please review the developer’s guide found here: http://docs.aws.amazon.com/xray/latest/devguide/xray-sdk-java.html
Step 1: Add the AWS SDK to your application
The next thing we need to do is import the AWS X-Ray SDK so that we can start getting traces into our X-Ray Service Map. Update your build.gradle, to add aws-xray-recorder-sdk-core and a few other libraries into your dependencies.
dependencies {
  ...
  compile 'com.amazonaws:aws-xray-recorder-sdk-core:1.1.2'
  compile 'com.amazonaws:aws-xray-recorder-sdk-aws-sdk'
  compile 'com.amazonaws:aws-xray-recorder-sdk-aws-sdk-instrumentor' }
At this point you could theoretically stop. You can push your code and you will begin to see traces in your X-Ray Service Map of your AWS::Lambda and AWS::Lambda::Function with a subsegment of Initialization. Per AWS documentation, this is because “the AWS SDK will dynamically import the X-Ray SDK to emit subsegments for downstream calls made by your function.” But wait, there is so much more we could be doing here.
Step 2: Add Custom Subsegments
Now let’s say that our function does a few things; download an S3 image, do some image manipulation then push it back up to S3.
public void handleRequest(String key, Size size) {
  Image image = downloadImage(String key);
  Image thumbnail = resizeImage(image, size);
  uploadImage(thumbnail);
}
Because you imported the aws-xray-recorder-sdk-aws-sdk-instrumentor you will automagically get subsegments for the S3 API calls. You could, however, create a your own custom subsegments for the image manipulation portion. Like so:
import com.amazonaws.xray.AWSXRay;
...public void resizeImage(Image image, Size size) throws SessionNotFoundException {
  // wrap in subsegment
  Subsegment subsegment = AWSXRay.beginSubsegment("Resize Image");
  try {
    Image resizedImage = image.resizeMagic(size.getWidth(), size.getHeight());
  } catch (Exception e) {
    subsegment.addException(e);
    throw e;
  } finally {
    AWSXRay.endSubsegment();
  }
}
You will now see a subsegment for resizing the thumbnail.
Step 3: Add Annotations to your Subsegments
So now that you have the custom subsegments, how do you know which one is which for, let’s say, large thumbnails versus small thumbnails? In comes annotations, which allows you to query your reports for a subset of your traffic.
*Note: you can only add annotations to subsegments, and not the root segment. I have seen where some people create a subsegment for the length of their handler, to which they add annotations and metadata, and then subsegments for the different subsections of that handler.
Simply updating our above code to this will give us this ability.
public void resizeImage(Image image, Size size) throws SessionNotFoundException {
  ...
  subsegment.putAnnotation("Size", size.toString());
  subsegment.putAnnotation("ImageFileSize",image.getFileSize());
  Image resizedImage = image.resizeMagic(size.getWidth(), size.getHeight());
  ...
}
Step 4: Add Metadata to your Subsegments
Additional useful tooling you can add is metadata to your subsegments. This can help you debug traces, for example, that have exceptions. In our image resizing example we could add things like image source size, or file type. That way when reporting on traces with exceptions we can drill down and see if we can narrow down root cause.
subsegment.putMetadata("source", "size", image.getSize().toString());
subsegment.putMetadata("source", "fileType", image.getFileType());
Reporting on your application
Ok, now that we have enabled X-Ray and instrumented our application it is time to head over to the AWS UI and start monitoring our application.
Service Map
After accessing your application a couple times, head over to the X-Ray dashboard in your AWS console. Make sure you are in the region where you deployed your microservice. You will start off on the Service map page. Here you will see something like the below with all the functions that have had hits in the last 5 minutes:
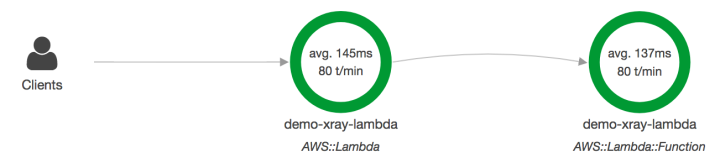
There are a couple things to note on this page. There is a search bar that you can use to filter requests either by service name, annotations or trace id. You can also change your time range to anything from the last 1 minute to the last 6 hours. , a start time and the length of time which again can be anything from 1 minute to 6 hours.
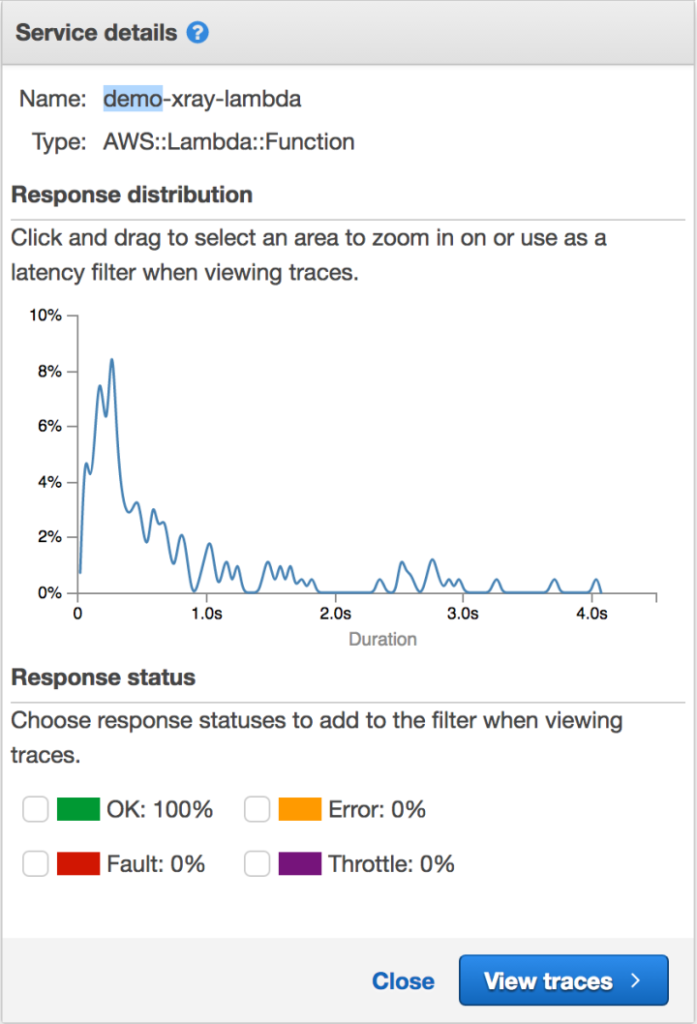
You can also click on a given bubble in your service map and see additional details as well as filter by response type, fault or throttling.
Indexing on annotations
At this point let’s take a look at filtering with annotations. In the status bar let’s type in the below:
service(id(name: "demo-xray-lambda", type: "AWS::Lambda")) { annotation.Size = "small" }
Then let’s change it to medium and we will see a slightly higher response time.
service(id(name: "demo-xray-lambda", type: "AWS::Lambda")) { annotation.Size = "large" }
Let’s take that a step further and see source images that are greater that 2 mb.
service(id(name: "demo-xray-lambda", type: "AWS::Lambda")) { annotation.ImageFileSize > 2 }
As I’m sure you are starting to notice, is that with this level of instrumentation and granularity you can start to get a better understanding of your application’s response times, where some of your pain points are, and what you can improve on.
Drilling deeper
Now that we took a bird’s eye view of performance of our application as a whole, let’s drill down deeper into individual traces. You can get there by clicking on View Traces in your Service Details panel or by clicking in the left navigation on Traces:
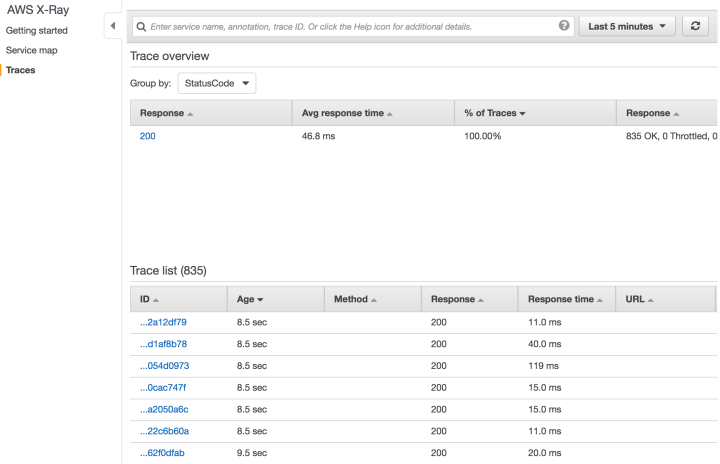
Here you will see all the requests that X-Ray chose to sample. You can click on an individual trace by clicking on its ID. This could look something like the below image depending on your application.
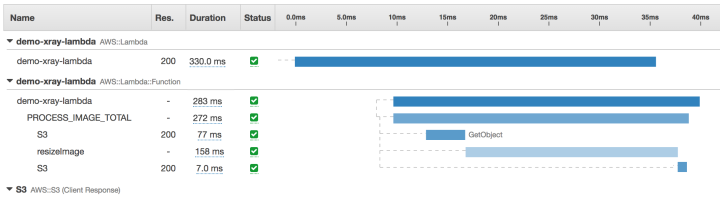
Here you can see each subsegment, its response times, and at what point in your service response time it executed. Also, if you click on a subsegment that, for example, you added annotations or metadata to in your code, you will get a popup panel that will allow you to view that data.
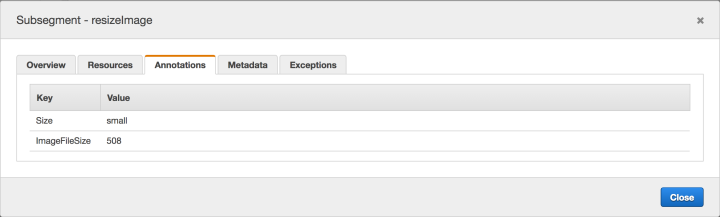
One use case for this, is to filter by error or fault and then click in the subsegments where we added source image data to the metadata to get a better idea on where the source of the problem is.
service(id(name: "demo-xray-lambda", type: "AWS::Lambda::Function")) { error = true }
Conclusion
As I’m sure you have probably noticed, with very little investment you can get pretty powerful visibility into your distributed application’s performance. AWS has simplified this process to the point where debugging, tracing requests and viewing the performance of a collection of service in one view can happen with just a few lines of code and a few clicks.
I hope this simple getting started guide gets you up and running. Let us know in the comment section below if you find this helpful and any suggestions or questions you may have.